SPOT
A Sprint Performance Optimization Tool that brings delivery metrics and client progress visibility together.
- My role
- Product Owner · Solutions Architect & AI Solutions Architect
- Status
- Actively used by the team and clients
- Categories
- Delivery Performance & Leadership · Data & Decision Intelligence
Outcome
Used by both the team and clients — delivery insight internally, and near-real-time progress visibility externally.
Business context
SPOT stands for Sprint Performance Optimization Tool. I created it to understand delivery pace and the relationship between engineering activity and results, while giving clients a direct way to see progress.
The challenge
I needed a clearer understanding of sprint pace, engineering contributions, and their effect on delivery. Clients also needed an accessible view of progress and results.
The goal: make delivery performance visible so the team can improve how it works and clients can follow the work being completed.
My role
I created SPOT as an internal product and served as product owner, Solutions Architect, and AI Solutions Architect. I defined the delivery questions it needed to answer and worked with engineers to structure and implement the solution.
How the workflow changes
The team reviews sprint and engineering metrics to understand pace and identify areas needing attention. Clients log into their own portal to see progress and results in near real time. That creates a shared basis for delivery discussions instead of answering every status question with a manually assembled update.
Product experience and design
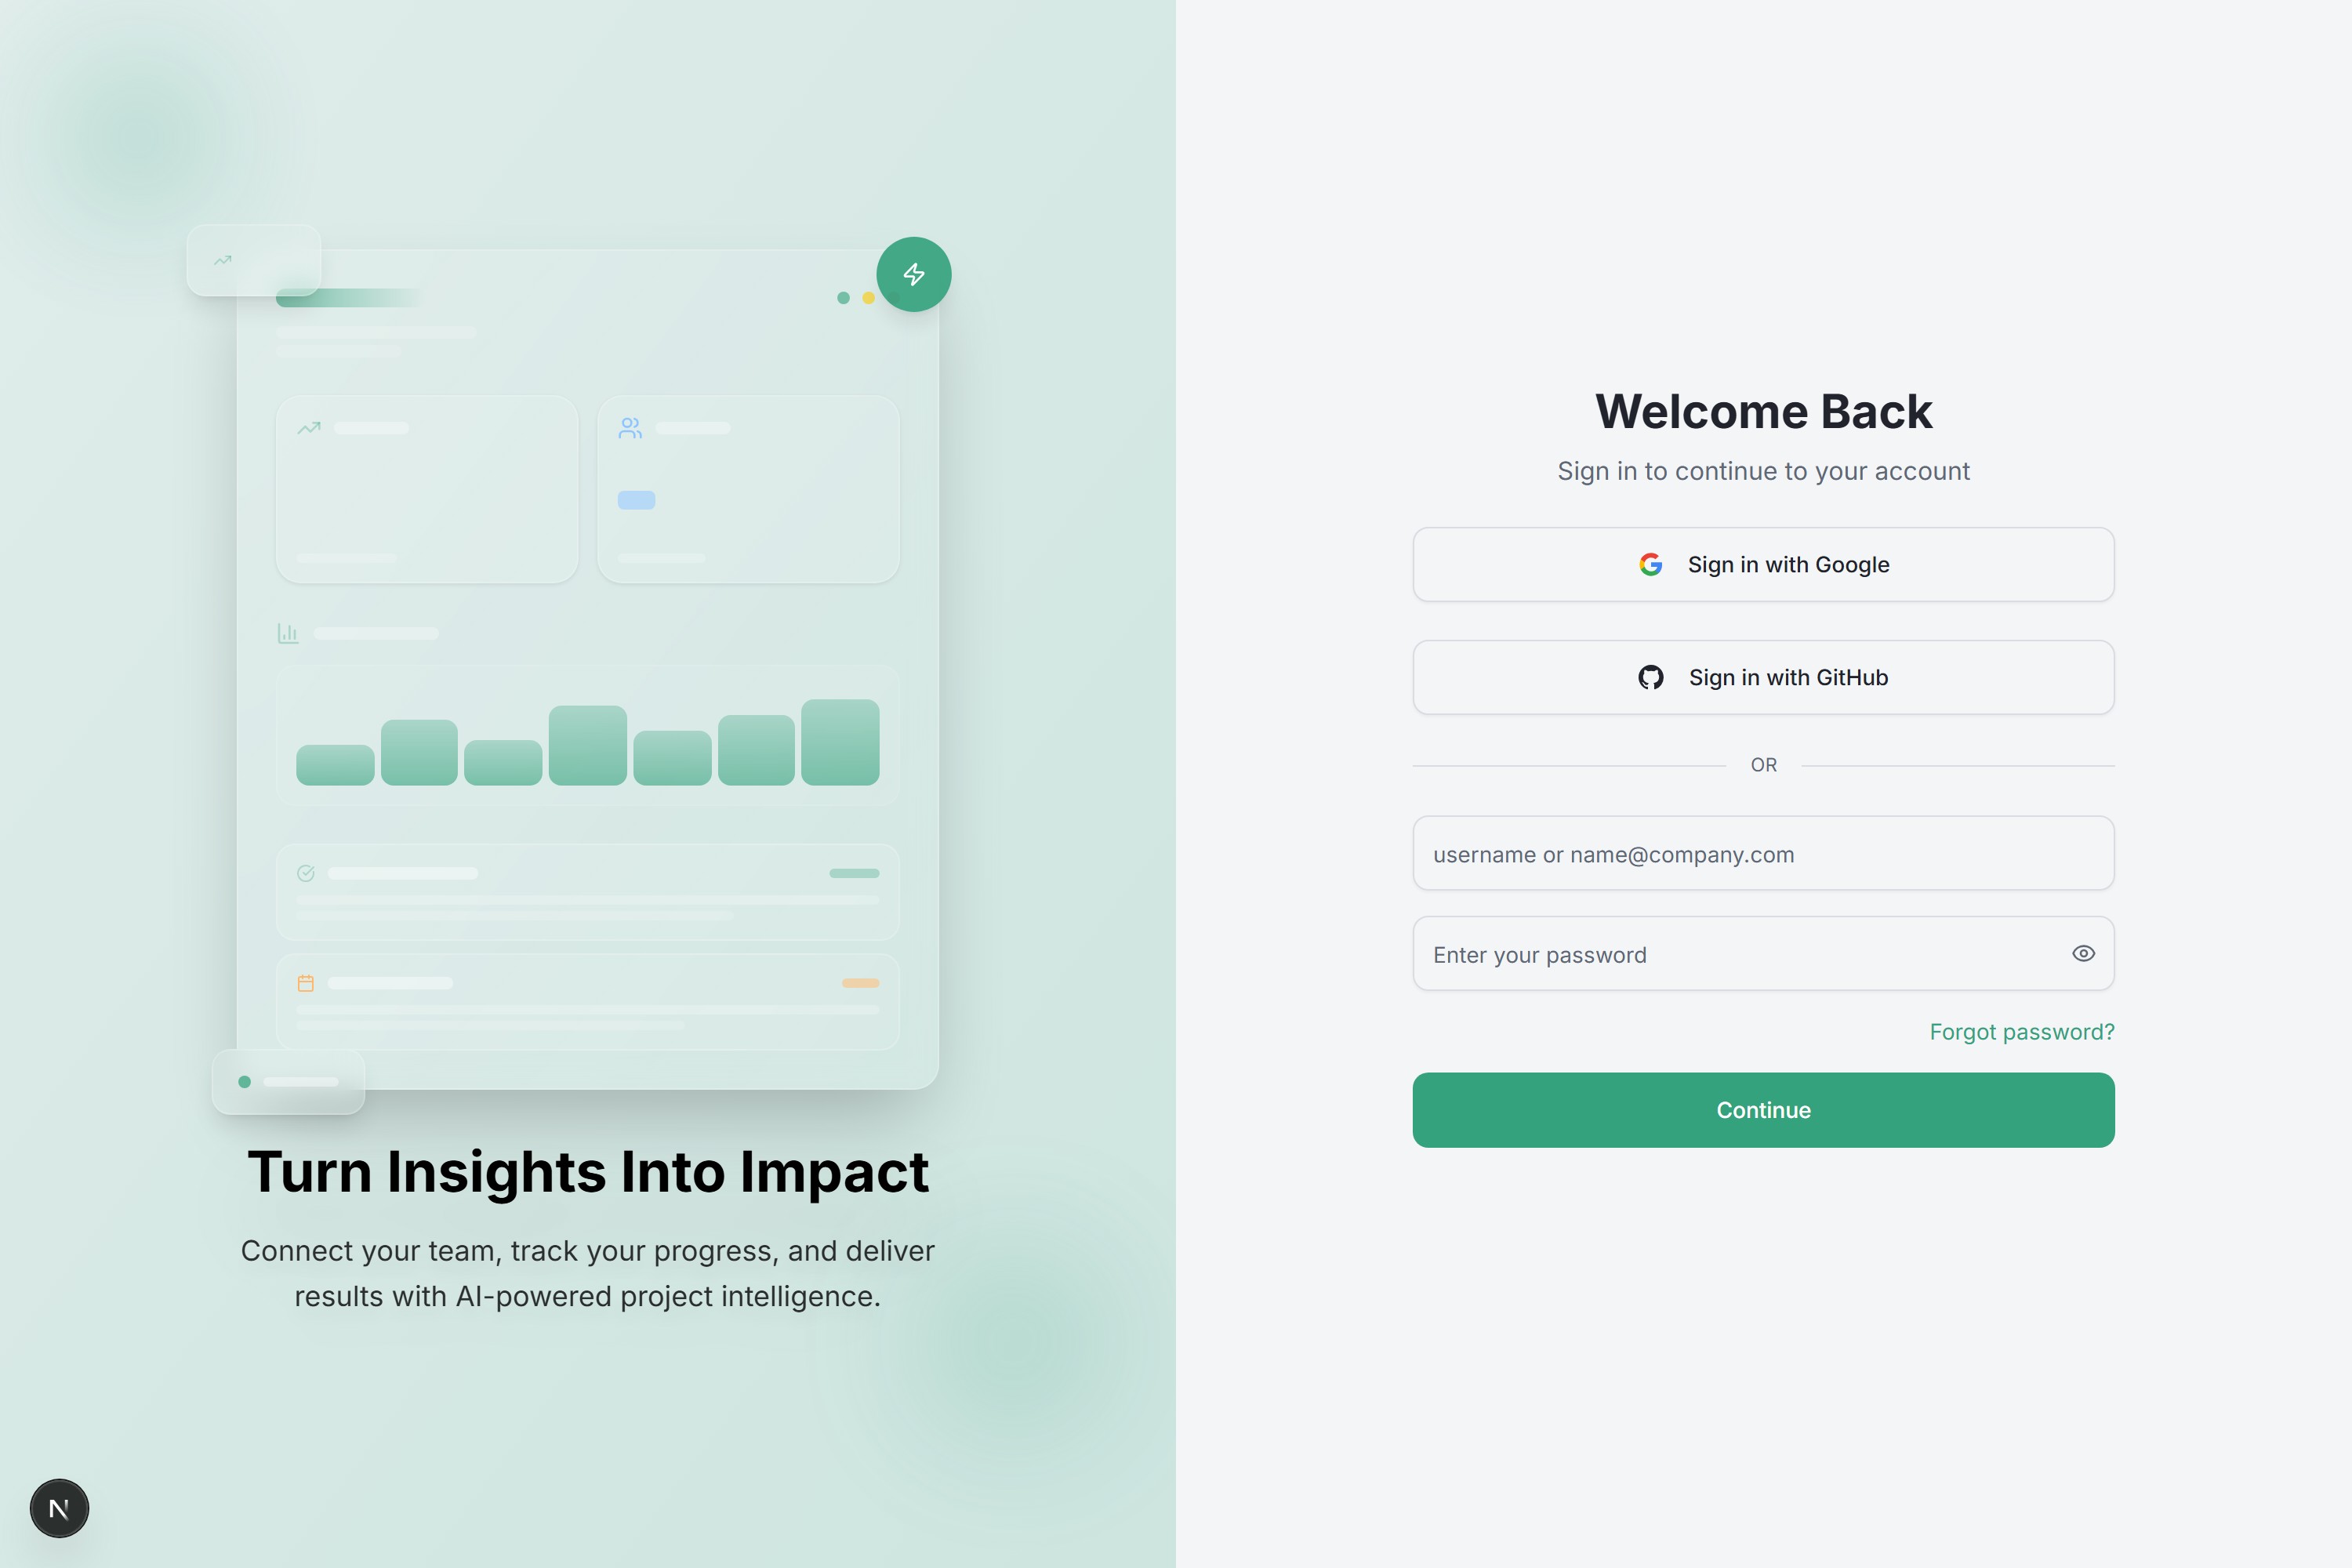
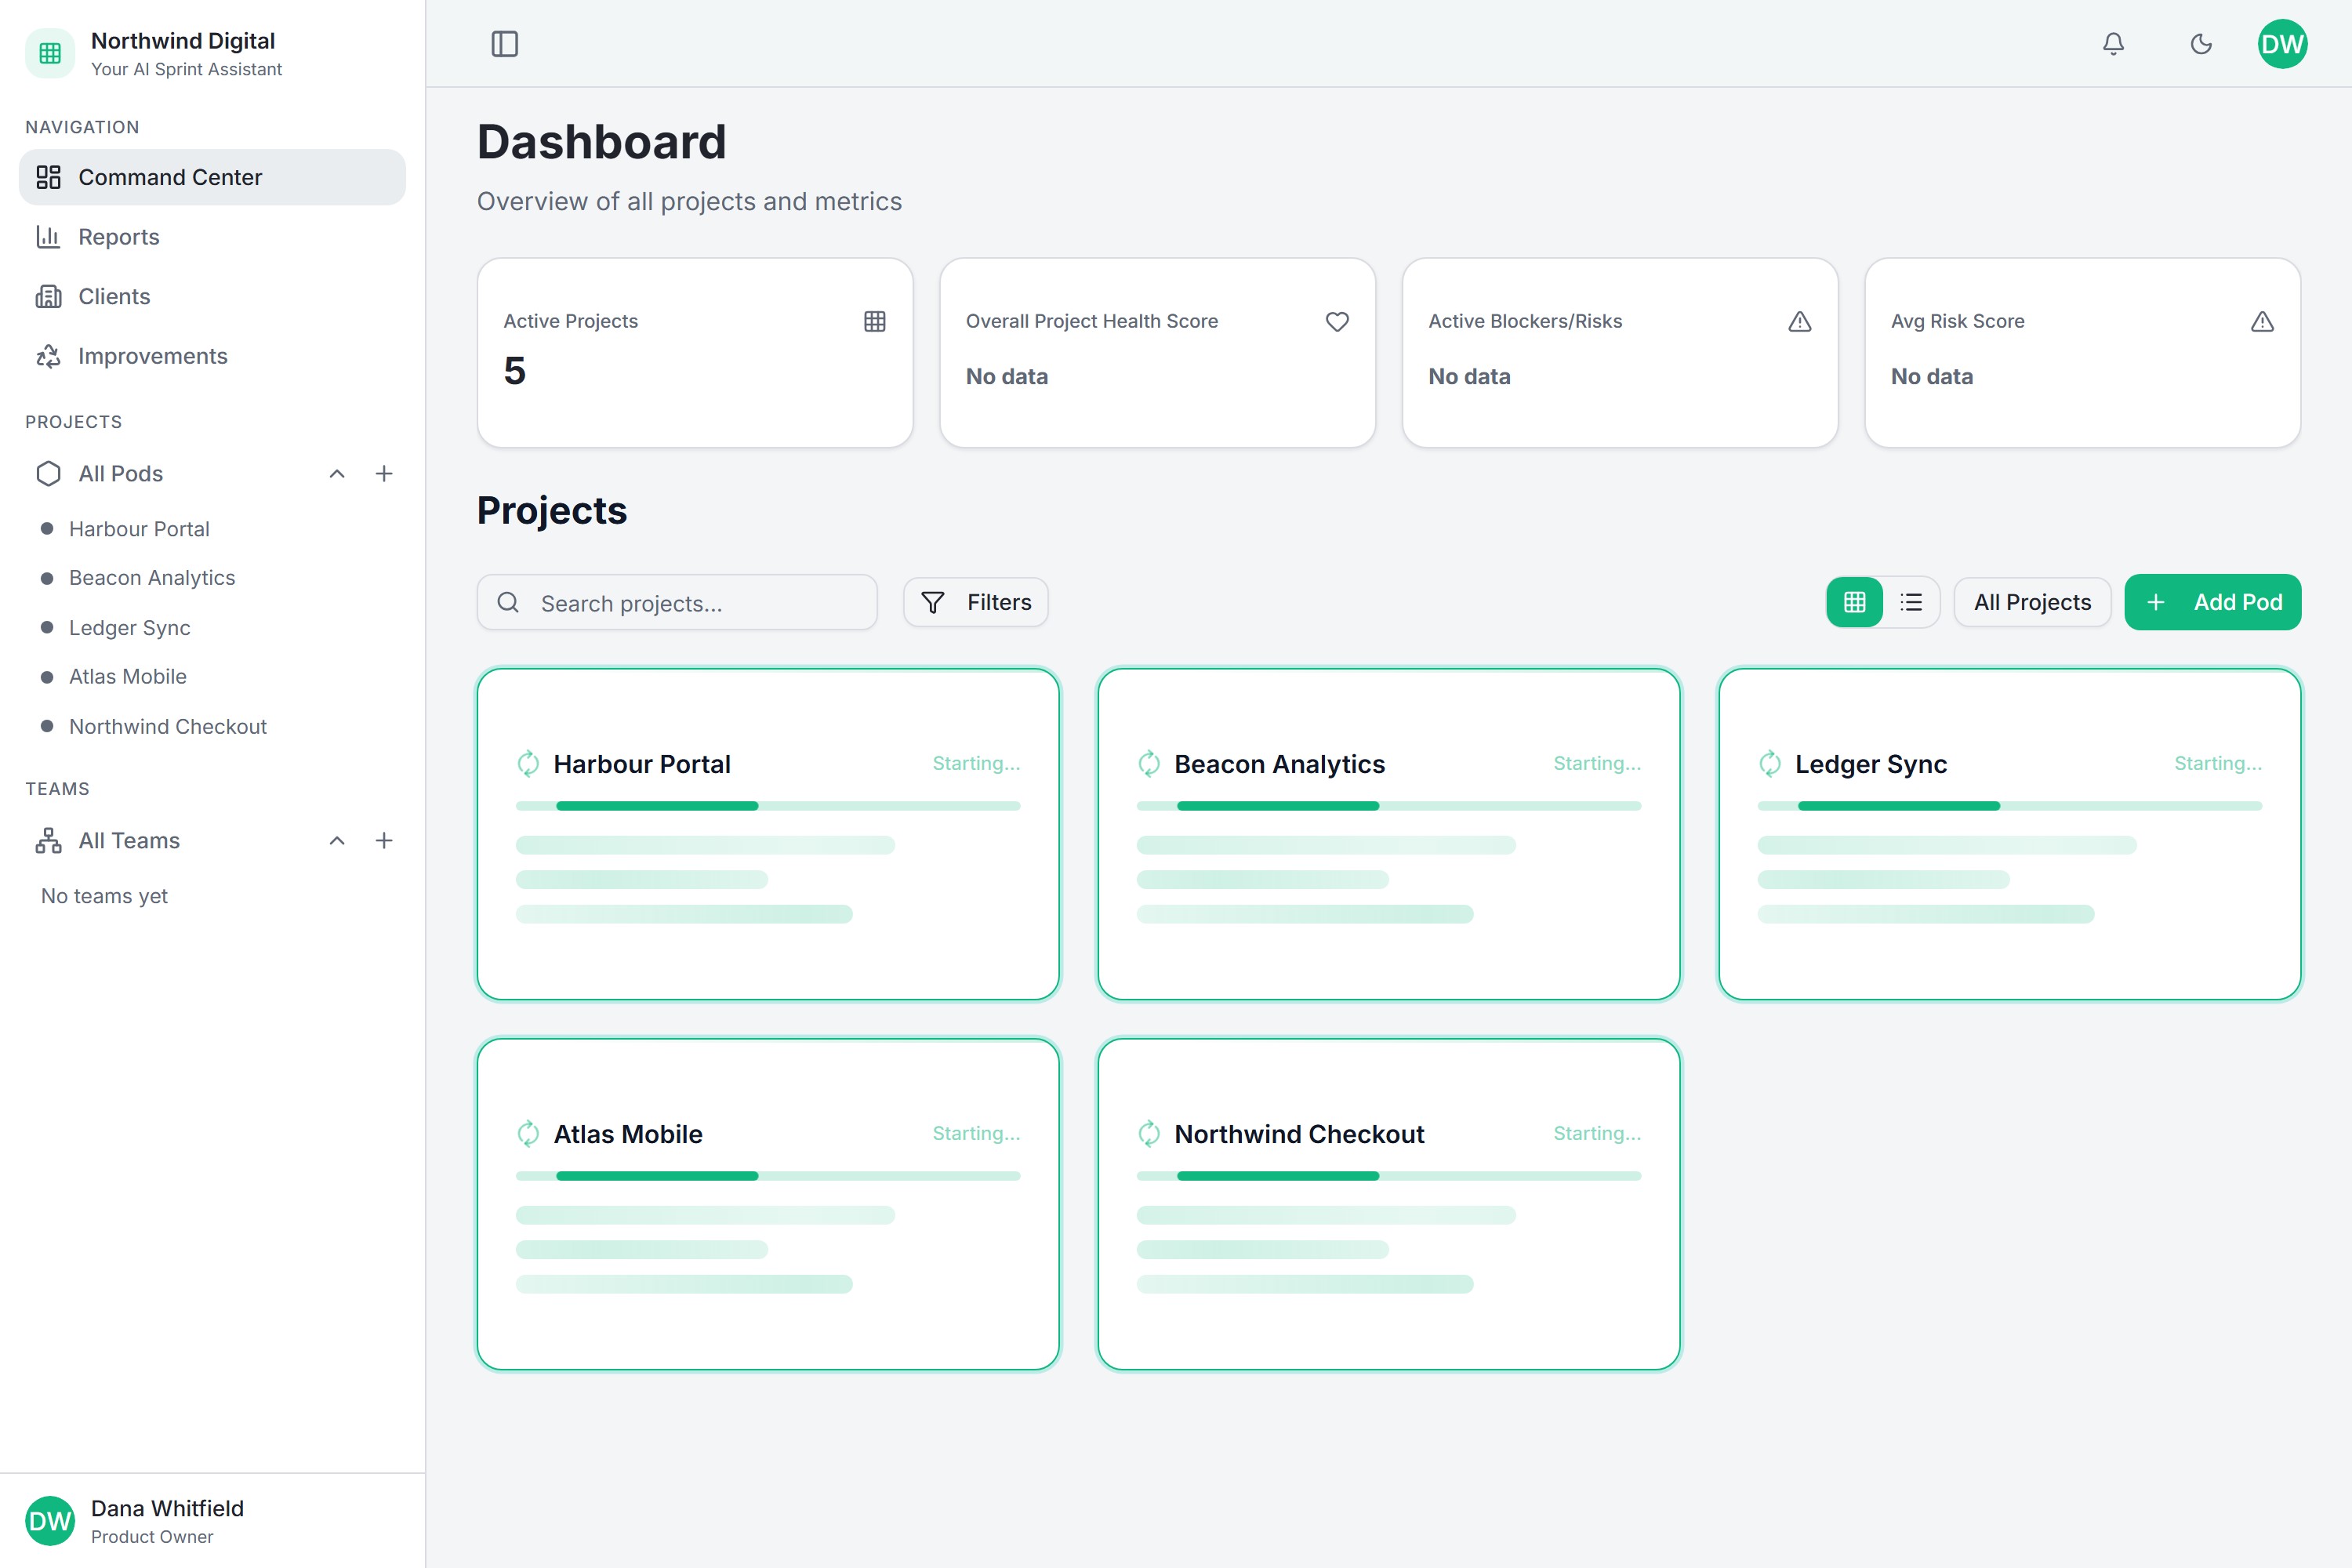
The interface centers on sprint health, velocity, burndown risk, and client visibility. Project cards surface status, while pre-sync states show placeholders rather than invented progress values.
Architecture and implementation
Data from Jira, GitHub, ClickUp, and Linear is normalized into a common task and sprint model. Prisma and PostgreSQL support the data layer, and Turborepo organizes shared code.
Delivery approach
I defined the tool from my own delivery responsibilities and guided its implementation with engineers. SPOT is also part of the delivery tooling used on Enroll Here and MuseOS — it supports visibility and process improvement alongside the rest of the delivery practice.
Results and current status
SPOT is actively used by both the team and clients. It provides delivery insight internally and direct progress visibility externally, and supports reviews of how the team works and where the delivery process can improve.
Scope
Published snapshot of the codebase — useful technical context, not a measure of customer impact.
- Screens
- 75
- Components
- 183
- API routes
- 324
- Data models
- 114
Screens
Solution and scope
- Sprint delivery metrics that show pace and progress
- Engineering metrics exploring individual contributions and their effect on delivery
- A client portal with near-real-time progress and results
- One shared information source for internal delivery reviews and client visibility
Built with
- Next.js 15
- React 19
- TypeScript
- Tailwind
- Prisma
- PostgreSQL
- Turborepo
- Jira
- GitHub
- ClickUp
- Linear